COMEX Gold analytics desk
See the flow before you place the order.
LevelQuants rebuilds order flow, footprint and option structure around the GC contract price — updated in near real time. Instruments for you to read and decide on your own, not buy-or-sell advice.
Open the chart
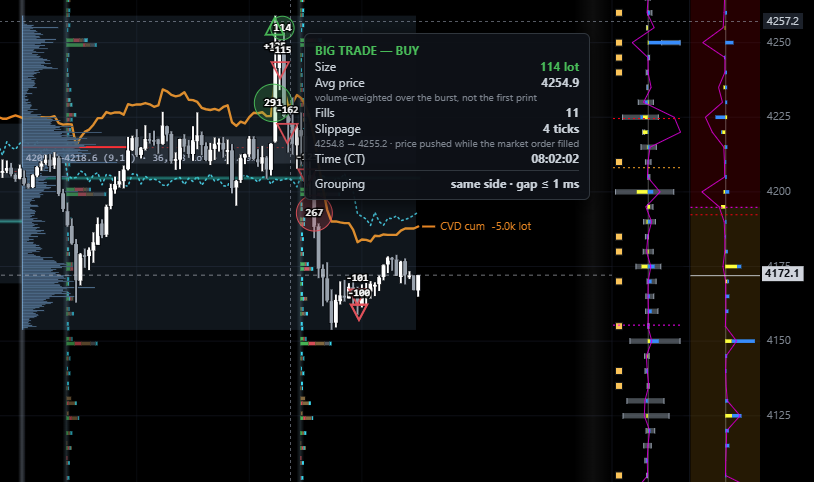
Captured directly from the LevelQuants chart — GC session, 2 Oct 2026.
Order-flow tools — exactly what the chart shows
Every image below is captured from the live chart. Each tool shows data that has already happened, for you to read yourself — no recommendations, no “buy” or “sell” button.
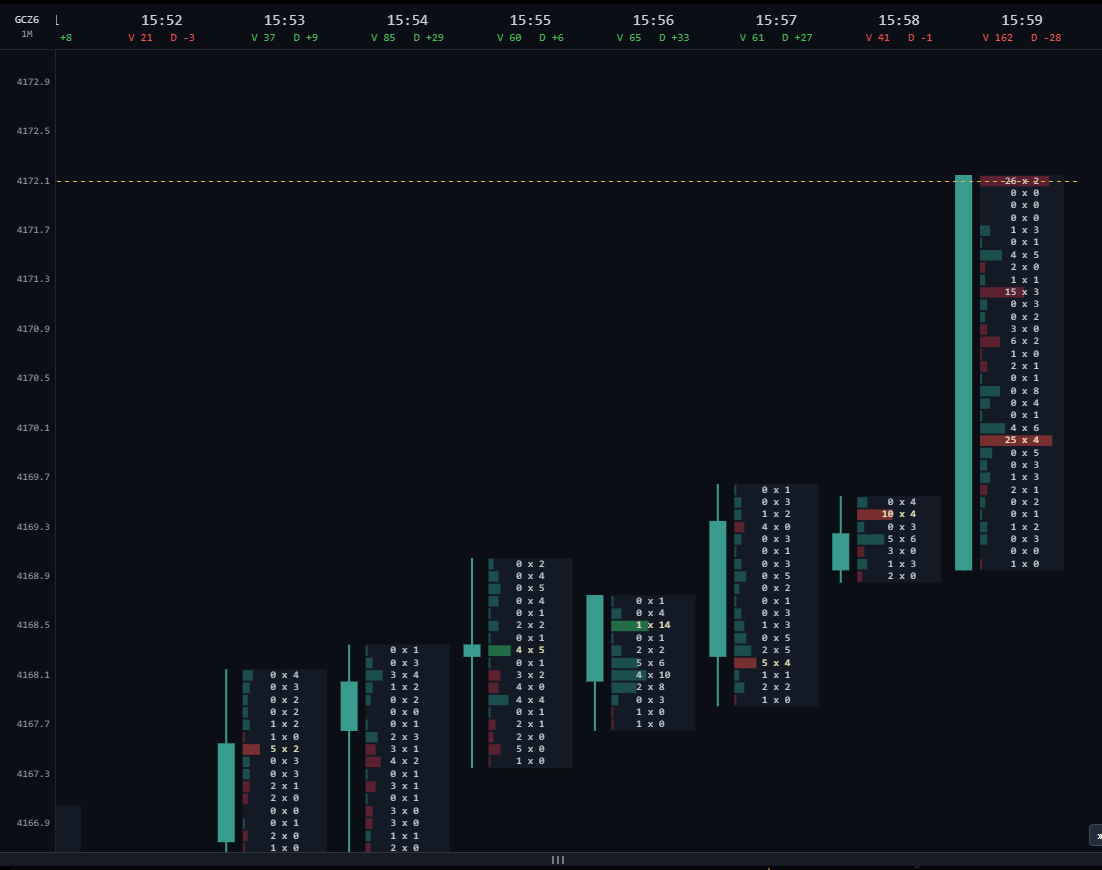
Footprint candles & order flow
Every trade crosses the tape as it happens. Each column is one minute, expanded into a bid × ask grid at every price level, with that minute’s total volume and delta.
- —Bid × ask footprint at each price level, highlighting cells above the volume threshold
- —Big trades grouped by side and time gap: size, average price, fill count, slippage
- —Cluster search for delta above threshold, cumulative CVD and session net delta
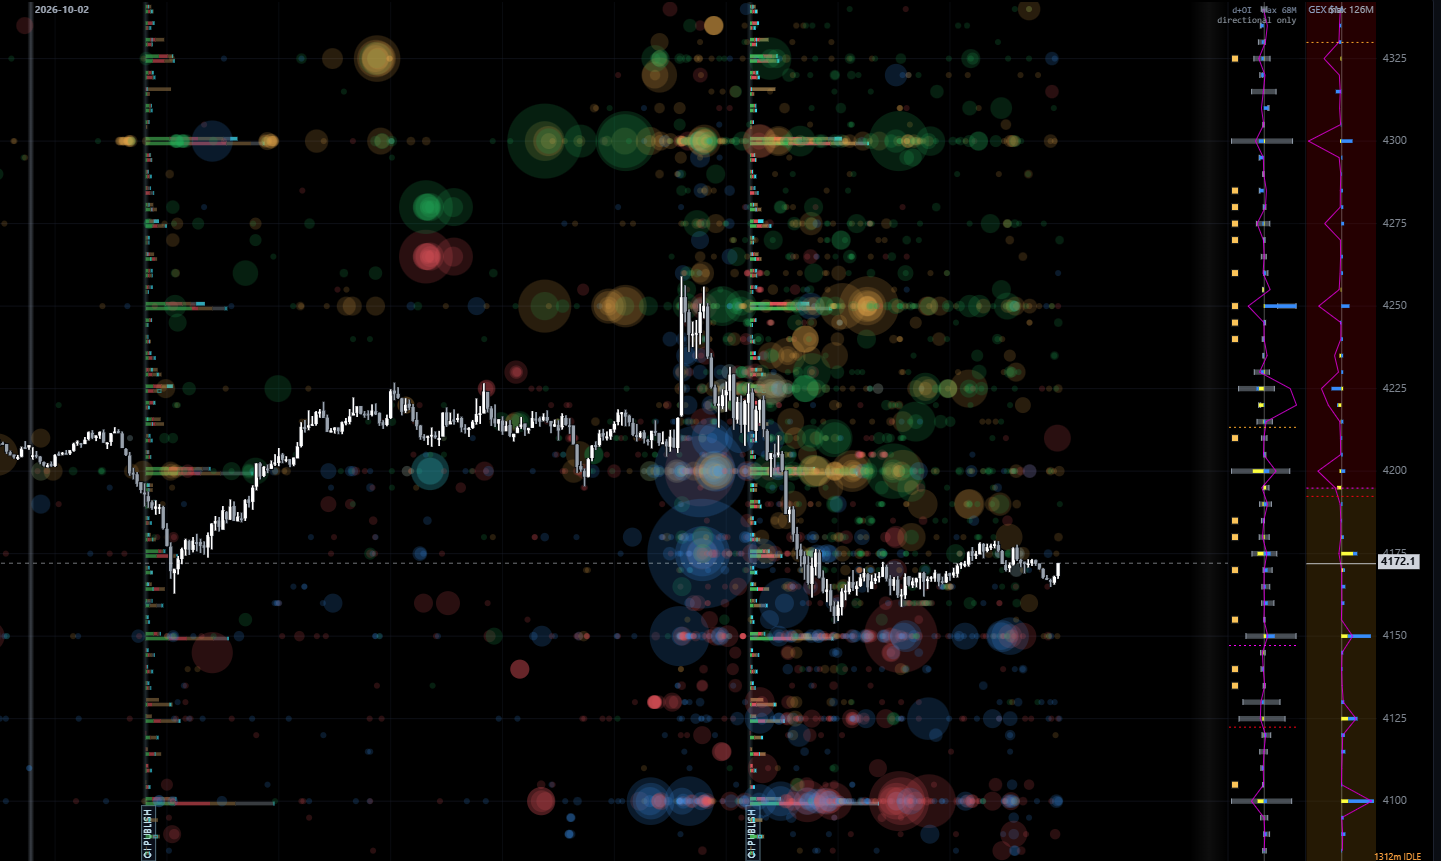
Intraday option trades
Option trades are drawn as bubbles (long / short option): vertically at the strike mapped onto the GC price axis, horizontally at the fill time, sized by lots. One look at a session shows which price levels the money went into.
- —Bubble size by lots, colour by trade type; lines connecting the legs of a spread
- —Hover for detail: strike, expiry, lots, average price, breakeven, multi-leg structure
- —Filter by lot threshold to keep only the large trades of the session
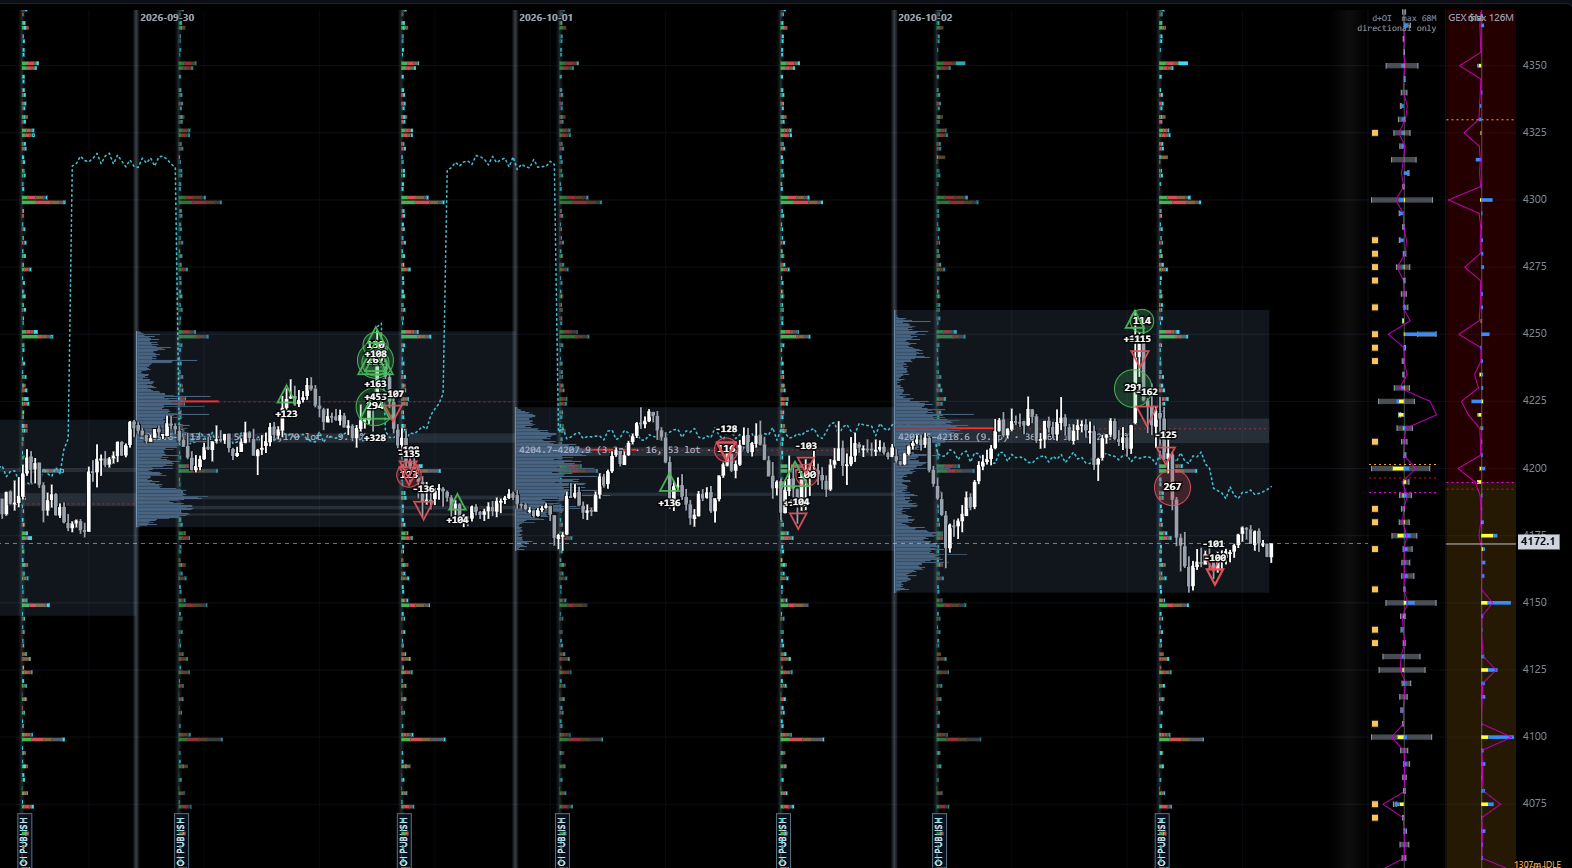
Gamma zones & OI publication
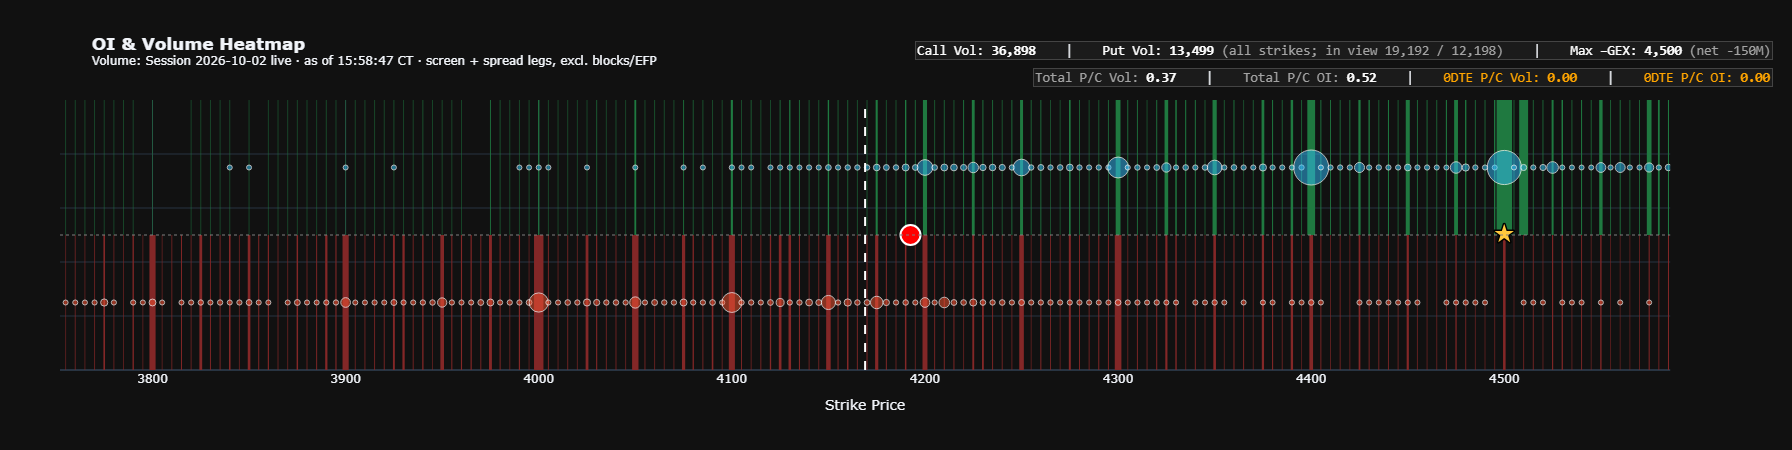
Open interest and the GEX profile are drawn on the same price axis as the candles, so gamma zones sit exactly where price is trading. Each time CME publishes OI, the chart plants an OI PUBLISH marker so you know when the numbers changed.
- —Gamma zone bands, gamma flip and zero-GEX levels set on the price axis
- —The OI PUBLISH marker flags CME’s two daily OI publications, separating preliminary from FINAL
- —Honest about OI without gamma — GEX is labelled a lower bound, not dressed up
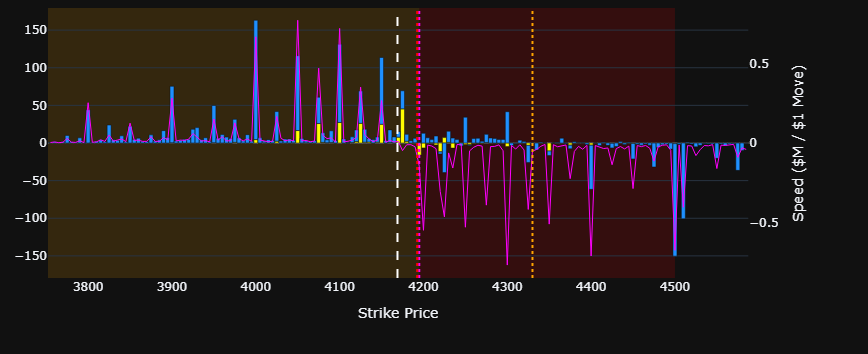
Vol surface & higher-order Greeks
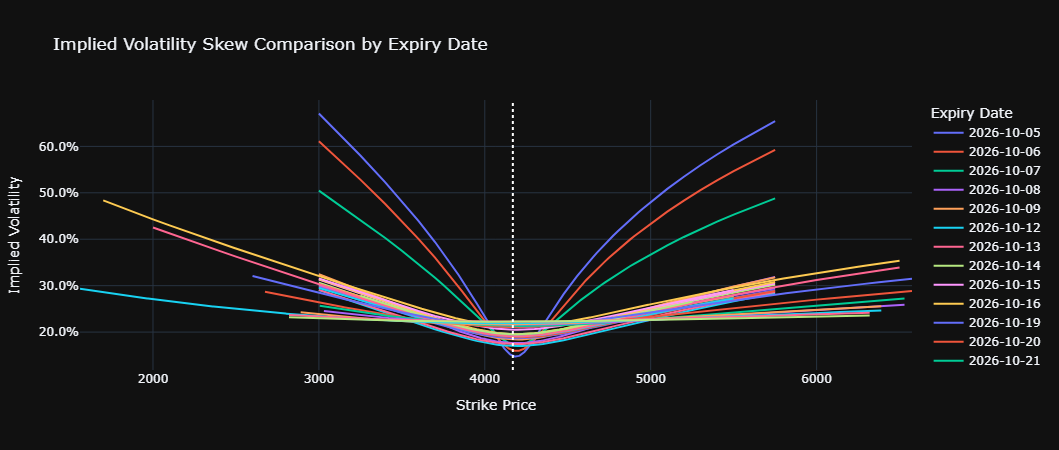
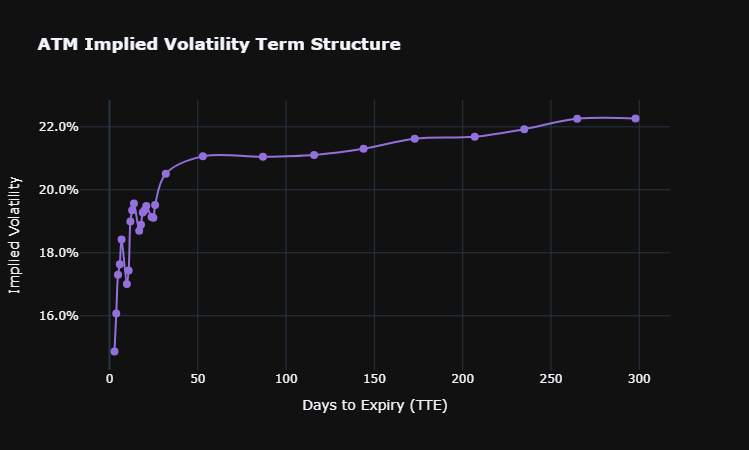
IV reads in two directions: across strikes it is the IV curve, across time it is the term structure. Both images are from the same moment, taken from the live option chain.
- —IV curve / skew per expiry date, overlaid for direct comparison
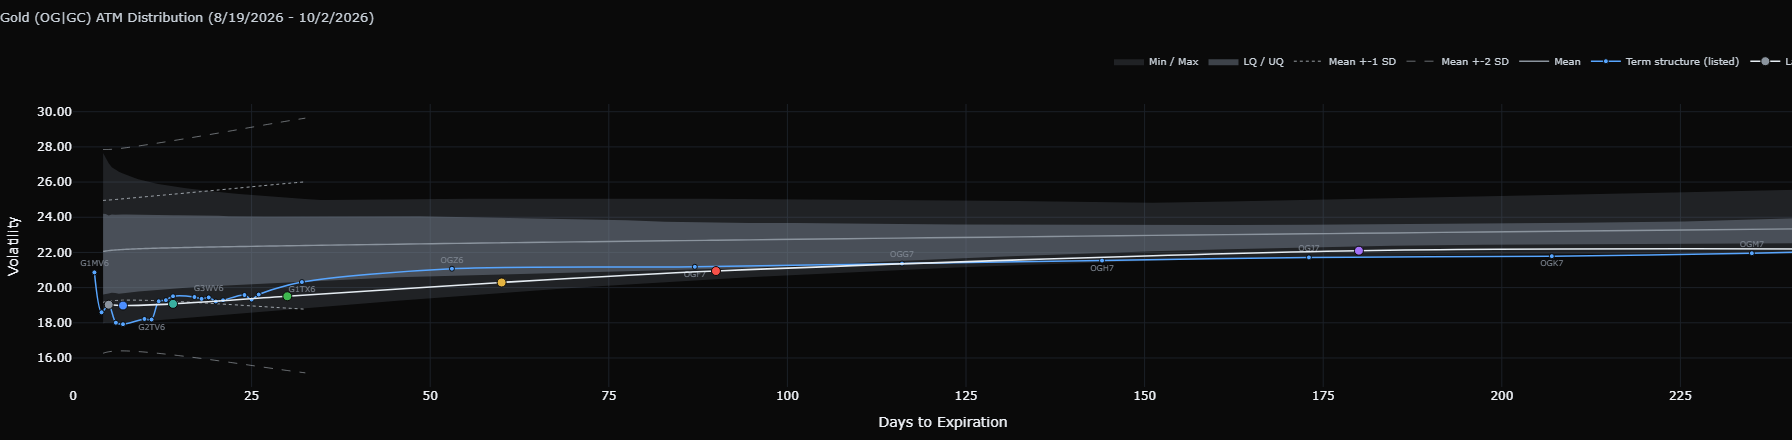
- —ATM IV term structure by days remaining, plus 25Δ risk reversal / butterfly
- —Vanna & Charm profiles by price for advanced users
Four steps to start
Sign up
Fill in your email, name and phone on the sign-up page.
Pay
Scan the QR code with the exact amount and reference.
Get activated
A confirmation email arrives once your account is enabled.
Log in
Open the chart with the one-time code sent to your email.
Read the gold market your own way
Open the chart now, or look at pricing first.